


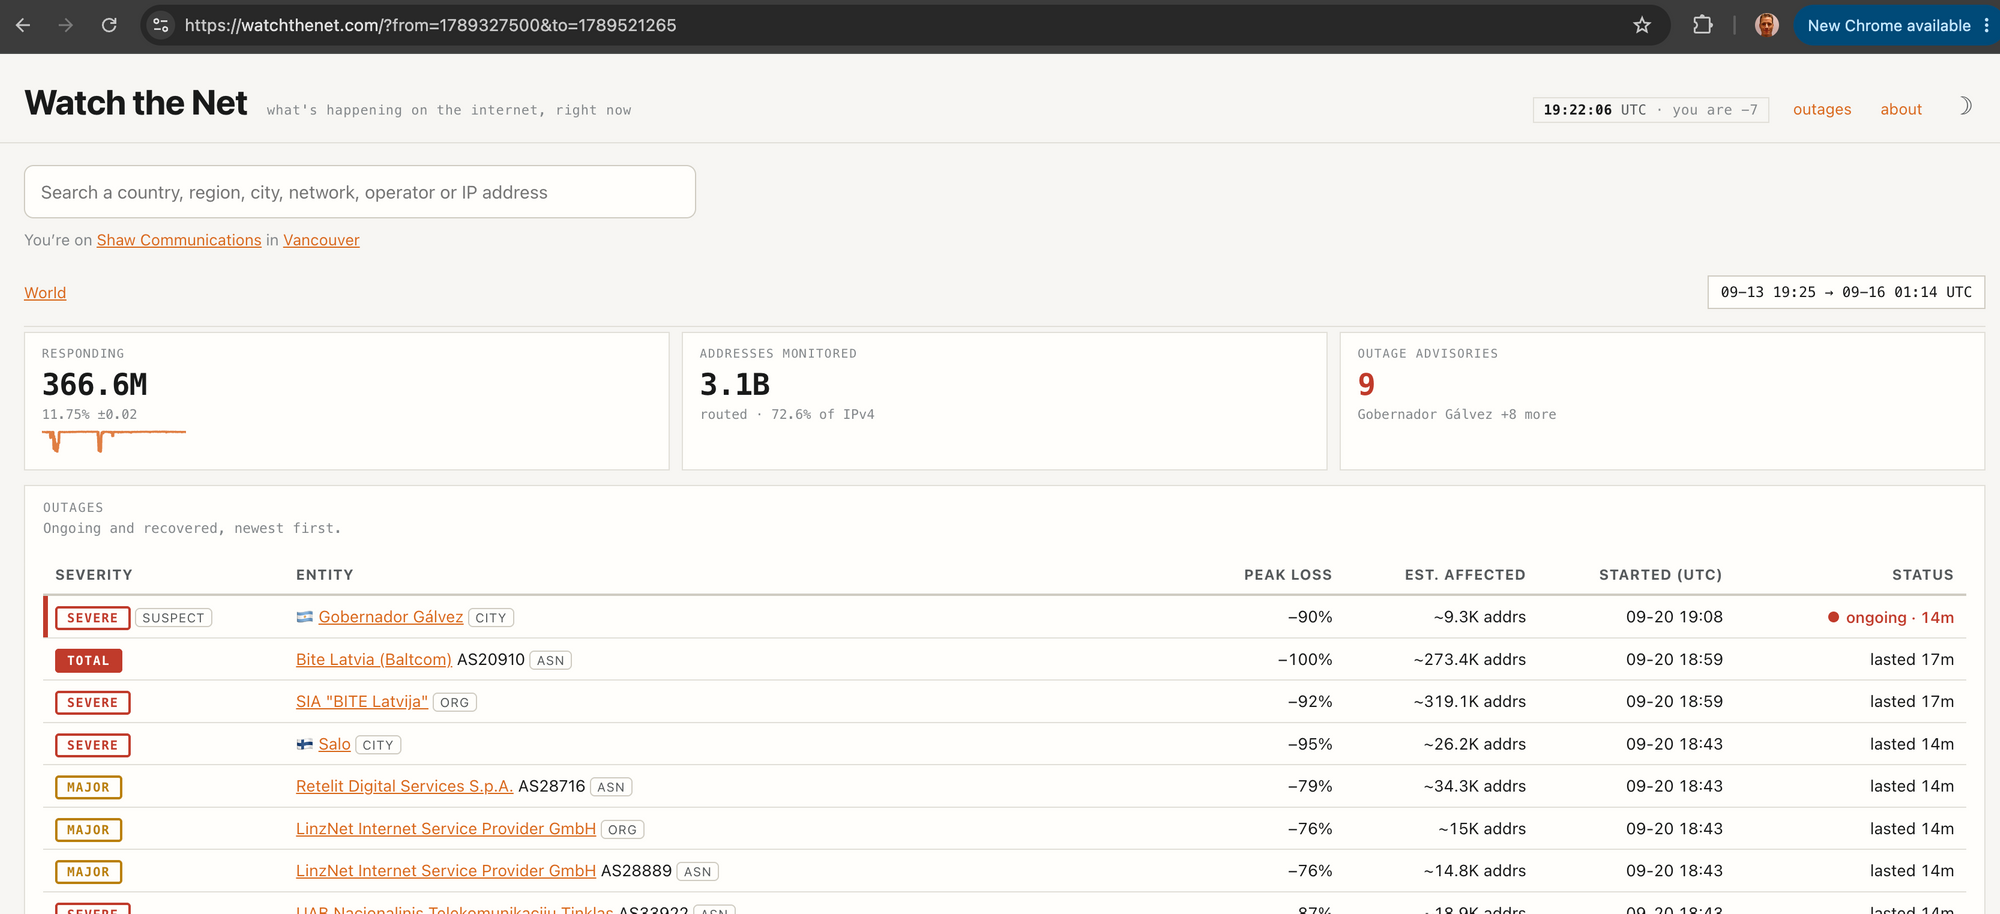
Today I'm releasing a fun new project I've been working on called Watch the Net.
It's a live view of what's happening on the Internet, based entirely on active measurements. You can drill down by country, region, city, ASN, organization, or even an individual IP address.
I've been posting screenshots from it on Twitter for the last few weeks, usually when something interesting breaks, and quite a few people have asked if they could play with it themselves. Well, now you can :)
The question I'm trying to answer with watchthenet.com is: What's happening on the Internet right now? Not inferred from BGP updates, news reports, or someone else's telemetry. I wanted to measure it myself.
And unsurprisingly, it combines two things I've been slightly obsessed with for a while: monitoring the Internet and sending packets fast.
Be the first to know
I've spent most of my career building and operating Internet infrastructure, which also means I've spent a lot of time dealing with outages :) One lesson I keep coming back to is be the first to know. You don't want your customers telling you something is broken. You want to already know.
That's why I've always been a big fan of synthetic monitoring. Don't just watch CPU counters, interface stats, BGP sessions, or logs. Actually send traffic and check whether things work.
I've wanted something similar for the Internet itself for a long time, and at times have built versions of it.
Countries, cities and networks all have their own rhythm. Most of the time things just work. Then something breaks and you wonder: what's the impact, and who else is affected?
I wanted to see that happening as close to real time as possible.
Meanwhile, I was making packets go fast
The other half of this started as a completely different project.
Over the last few months I've gone pretty deep into high-speed packet processing in Go. First AF_XDP, then DPDK, then Mellanox Direct Verbs, and eventually all of them behind one library called packetio.
On a 100G ConnectX NIC, packetio can send around 148 million packets per second with just a few cores. I was pretty happy with that number.
Then one evening I did some very simple math that I somehow hadn't done before.
There are about 4 Billion IPv4 addresses. Remove private space, multicast, loopback, reserved ranges and everything else we don't care about, then look at what is actually announced in BGP today, and you're left with roughly 3.1 billion routed IPv4 addresses.
At 148 million packets per second, you could send one packet to every routed IPv4 address in about 21 seconds.
Even if you sent two probes to every address, you're still talking about reaching every routed IP on the Internet in under a minute. That's pretty crazy, right?!
Combining my interest in Internet events like outages and sending packets fast is kind of how Watch the Net started.

What Watch the Net does
The basic idea is relatively simple. Watch the Net continuously walks the routed IPv4 Internet and sends two small probes to each address: an ICMP echo request and a TCP SYN.
If an address responds to either, I consider it reachable. Using two probe types helps because plenty of networks drop ICMP but will happily respond to a TCP SYN. A SYN-ACK counts, but so does a TCP RST. If a machine tells me there's nothing listening on that port, it still answered.
The same goes for ICMP errors. If the target itself responds, that's evidence that it's there. I don't inspect payloads or try to figure out what software you're running. I'm really only asking one question: Are you there?
There is one thing I do check. Every probe contains a small fingerprint derived from the destination address and a secret unique to that scan, tucked into fields that come back in the response, like the ICMP sequence number or TCP sequence number.
When a response arrives, I recompute that fingerprint from the source address. If it matches, I know it was in response to something I sent. If not, I ignore it.
A nice side effect is that the scanner can be completely stateless. I never need to remember what I sent or keep a giant table of outstanding probes. One goroutine sends, another receives, and they don't even need to talk to each other.
I really like this part. It keeps the scanner surprisingly simple, even if you scale it to millions of probes per second.
Being a good Internet neighbour
Those responses are grouped by geography and network metadata and turned into time series for countries, regions, cities, ASNs and organizations. On top of that sits an outage detector looking for significant changes from normal reachability.
Right now I'm scanning just over 3 billion IPv4 addresses at around 500,000 packets per second, which works out to a full sweep every 3.5 hours. I could go much faster, but deliberately don't.
At that rate, an entire /24 sees a pair of probes roughly once every 49 seconds. The scan order is randomized as well, using BlackRock from the masscan lineage, so consecutive probes land in completely different parts of the Internet rather than creating bursts toward individual networks.
The end result is a very small, evenly distributed amount of traffic. I want the measurements to be useful, but also want to be a good Internet neighbour.
All of the resulting measurement data ends up in DuckDB. I've been looking for a good excuse to use it for a while, and this turned out to be a great one. I've been really impressed by how well it performs with this kind of data.
So, what does it see?
This is where it gets fun :)
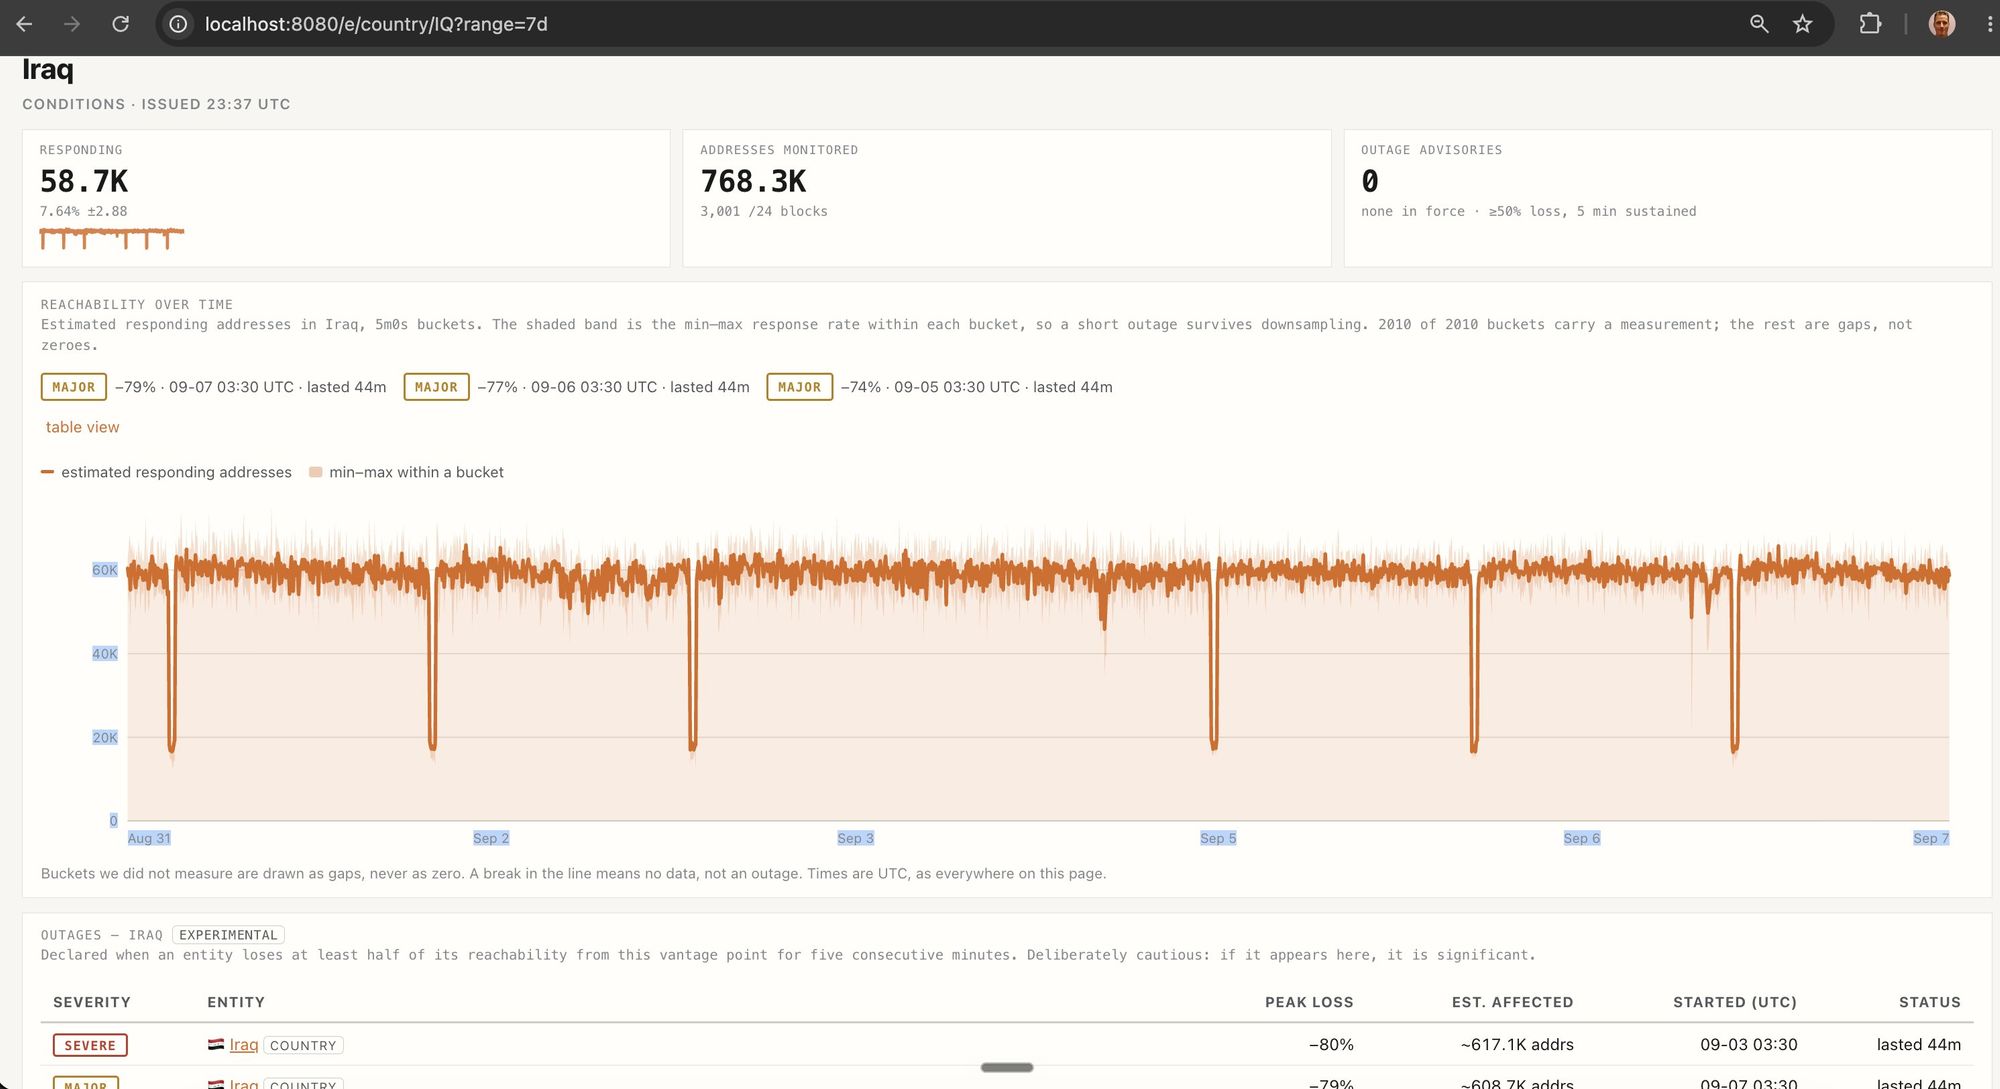
Iraq disappears every morning
One of the first patterns that jumped out at me was Iraq. At almost exactly the same time every morning, roughly 80% of the country's responding addresses would disappear, then come back about 44 minutes later.
The timing was remarkably consistent: around 03:30 to 04:14 UTC.
I've followed Internet outages for a long time and I'd heard of this before. Iraq has been shutting down Internet access during school exams for years to prevent cheating.
A quick search confirmed they were doing it again this year. Internet Society Pulse lists the official shutdown window as 06:20 to 07:10 local time, or 03:20 to 04:10 UTC.
Watch the Net measured roughly 03:30 to 04:14 UTC.
That was really cool to see. I already knew these shutdowns happened, but now I could see them firsthand in my own measurements and pinpoint them almost to the minute.
There was one other nice detail: September 4th was missing from the sequence. That was a Friday, the weekend in Iraq.
When 80% of a country disappears at once, the aggregate changes quickly, even though each individual /24 is only being probed lightly.
Portugal
Another good example happened recently in Portugal.
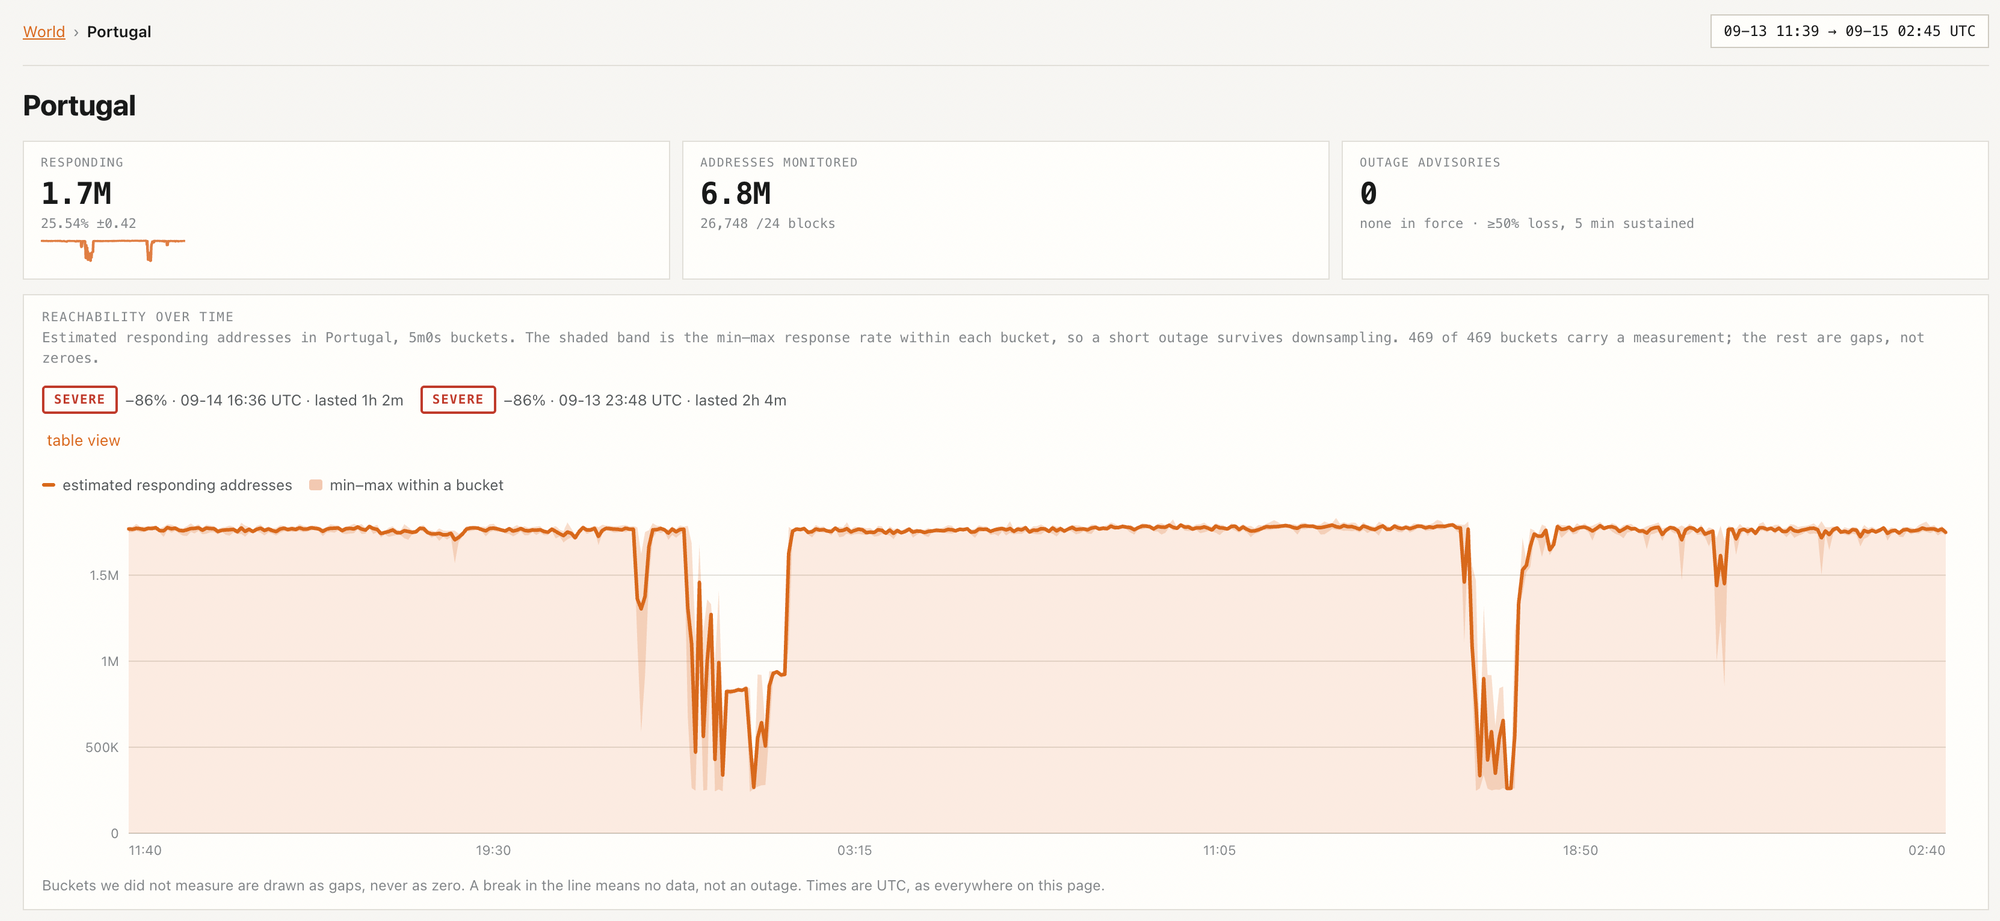
Late on September 13 UTC, Portugal's measured reachability suddenly dropped by around 86%, representing roughly 5.9 million addresses.
The big one was MEO, AS3243.
Its measured reachability basically went to zero. Porto dropped 87%, Braga 97% and Lisbon 79%. Then it recovered.
About seventeen hours later, almost exactly the same thing happened again. Same country, same operator, same magnitude.
At the time, all I had was the measurement. But it already told me something useful: this wasn't a random collection of endpoints disappearing across Portugal. The impact was heavily concentrated in one operator.
A couple of days later, MEO confirmed that it had been hit by a large DDoS attack that caused congestion and temporary degradation of its international network.
The timing lines up surprisingly well too.
Watch the Net saw the first event begin at 23:48 UTC, which was 00:48 local time in Portugal. MEO later reported impact beginning around 00:45.
That's exactly the kind of visibility I was hoping to get from this project.
Donetsk, Hawaii
There have been plenty of other interesting examples.
Donetsk, September 18. The region's measured reachability dropped roughly 90%, with the city itself dropping even further. Ukraine is somewhere I watch fairly closely, and outages there often have a very geographic shape. Parts disappear and then recover in stages.
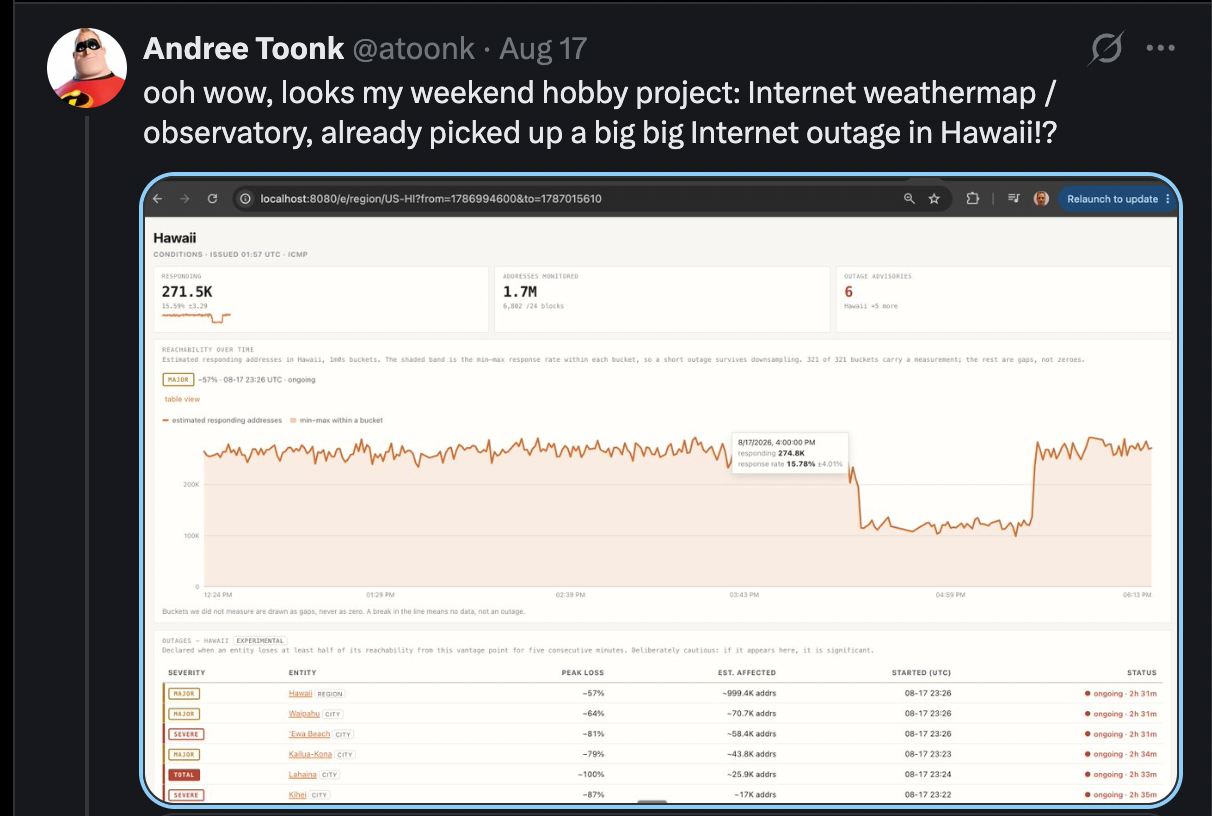
Hawaii, August 17. This was the first big one I spotted when i just started. Around 57% of the state's measured responding addresses disappeared. Kailua-Kona dropped 79%, 'Ewa Beach 81%, and Waipahu 64%. A few hours later it recovered. This was due to a tropical storm causing power outages.
The Internet has a rhythm
At country scale, Internet reachability is generally pretty stable. There is some normal variation throughout the day, but complete countries don't just disappear very often.
That's part of what makes the bigger outages so easy to spot. When a country suddenly loses 50%, 70%, or 90% of its normal reachability, the shape changes dramatically.
Things get more interesting when you zoom in to individual networks.
University networks are a great example. You can actually watch the campus wake up in the morning and quiet down again at night. Weekends look different from weekdays, and the start of a new school year can show up directly in the number of responding IP addresses.
I saw this recently at the University of British Columbia. Over the long weekend the network was relatively quiet, then students started coming back and the number of responding addresses climbed noticeably. I posted a graph of that here.
The same thing is even clearer on SURF, the Dutch university network and, coincidentally, one of the first ASes I ever worked on. During the week you get these very obvious daily peaks as campuses wake up, almost nothing on the weekends, and then much larger peaks once the academic year starts.
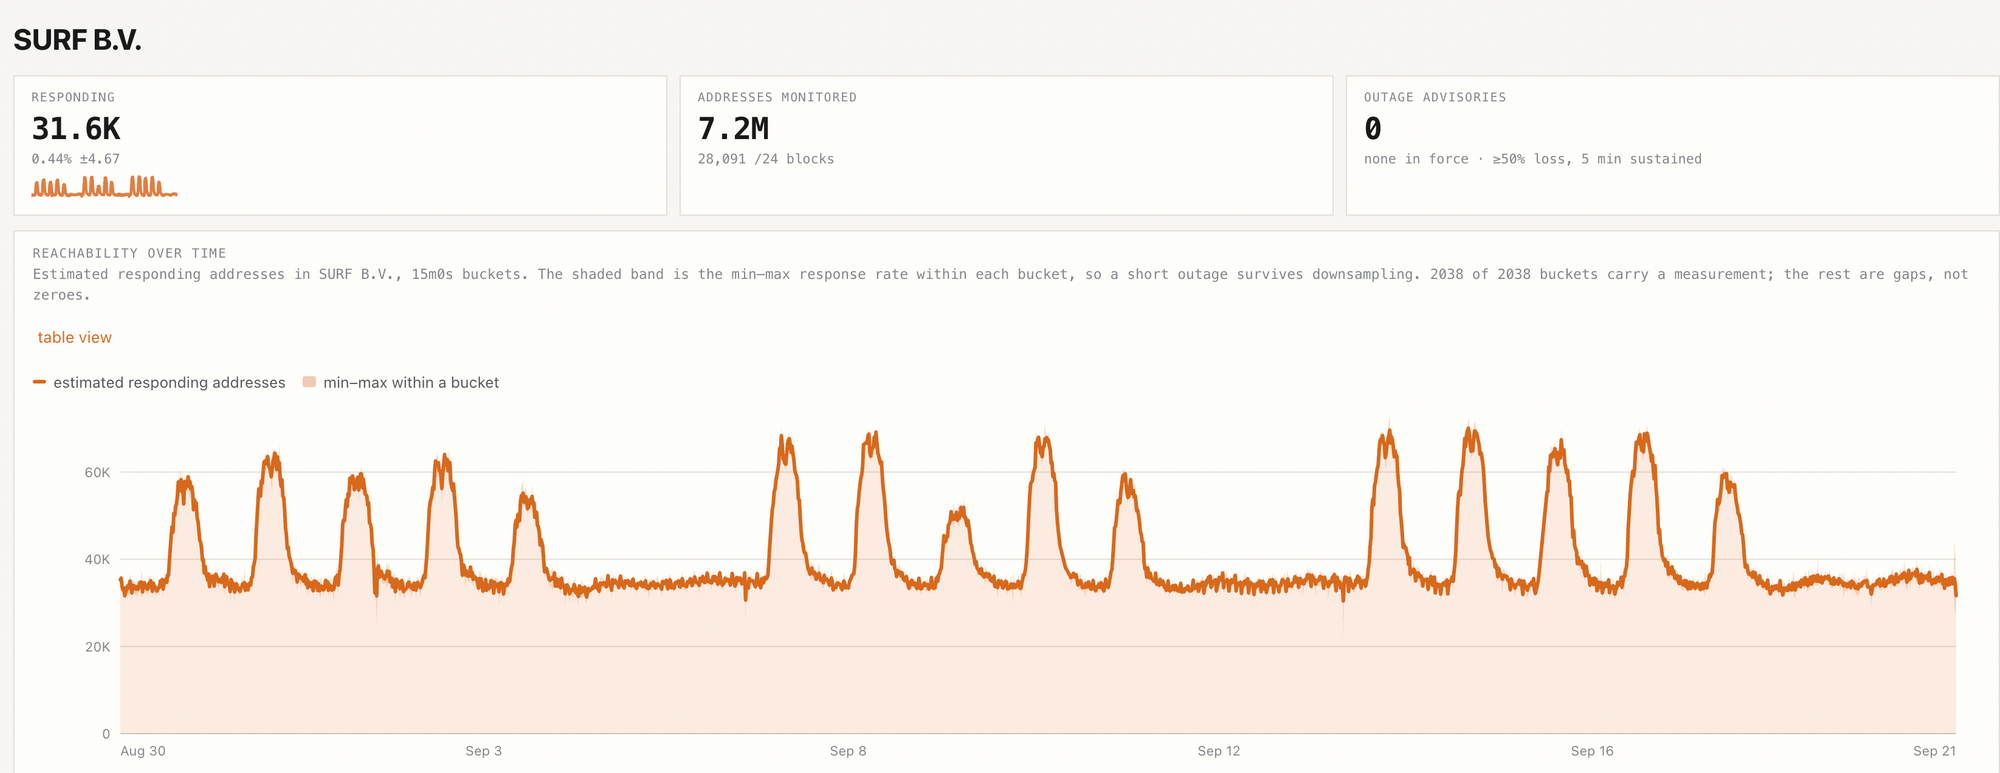
I really like this part of the data. Outages are obviously interesting, but you can also see the normal ebb and flow of how networks are actually being used. (It does make you wonder though: do all those students get public IP addresses?).
Go have a look
You can search for a country, region, city, ASN, organization, network, or individual IP address and see its reachability over time.
There's also a worldwide view, a map, recent outage advisories, and individual outage pages where you can drill into which underlying networks were affected.
For now, an outage advisory requires an entity to lose at least 50% of its normal reachability for five consecutive minutes.
That's deliberately conservative. I'd much rather have a small number of alerts worth looking at than a constant stream of noise.
I've been using the site myself for the last few weeks, and it's quickly become one of those tabs I leave open all day. Most mornings I check it to see what happened overnight :)
Wrapping up
This has been a really fun project to work on because it brought together two things I've been obsessed with for a while: understanding what's happening on the Internet, and figuring out how to send packets really fast from Go. It's been fun to use the packetIO library for an actual application.
For this, the speed was never really the interesting part. What matters is that it makes it practical to continuously ask billions of Internet addresses a very simple question and turn the answers into something we can watch.
There are a couple of obvious caveats. Watch the Net is IPv4 only for now, and all of these measurements currently come from a single vantage point. IPv6 needs a very different approach, and adding more vantage points would give a much richer view of what's happening from different parts of the Internet. But for that we need a project sponsor, as my various hobby project are slowely getting out of hand :)
For now, though, I'm pretty happy with what this already makes visible.
So go have a look at watchthenet.com.
If you find something interesting, weird, or just plain wrong, I'd love to hear about it.
That's it, thanks for reading!
Cheers
-Andree